Feeder Cattle Auction Basis Patterns
This study aims to provide an overview of trends and factors that should be considered when evaluating alternative markets to help set price expectations and inform marketing and price risk management decisions.
In order to create a framework for this type of evaluation, a database of historical cash prices, futures prices, and resulting basis information has been assembled from the following weekly state-graded in-barn feeder cattle auctions:
- Farmers Livestock Exchange, Inc. - Winchester, VA
- Lynchburg Livestock Market, Inc. - Rustburg, VA
- Rockingham Livestock Sales, Inc. - Harrisonburg, VA
- Senterfitt/Virginia Cattle Co. - Radiant, VA
- Southside Livestock Market, Inc. - Blackstone, VA
While this is not a comprehensive list of all cattle markets in Virginia and cattle-producing regions of the state, these locations were selected based on the historical data available for weekly state-graded feeder cattle sales across the 2016-2021 time period of evaluation. Price data were collected from the Virginia Department of Agriculture and Consumer Services Market News Service and tabulated into monthly price averages broken down by animal type for each location. These data are from only “in-barn” sales, meaning those in which a producer could drop their animals off at the market and buyers would purchase animals either in the ring or after having observed them in the holding pens. Animal type is determined by weight in 100-pound categories ranging from 300-399 lbs to 700-799 lbs; steer or heifer; medium and large frame size with #1 or #2 thickness. This study is not intended to be an exhaustive analysis of markets across the state, as many substantial marketing channels are excluded, but is designed to create a framework through which risk management analysis can be performed at the local level as markets continue to evolve.
One of the most effective ways to predict local cattle prices is to use historical market trends averaged across a period of time. This study focuses on basis calculations across the five locations for which data was collected and formulated. Basis is a fairly simple concept, but its importance and impact should not be underestimated. Basis is the difference between the local cash market price and the futures (CME Group) market price. It is given by the following equation:
Cash Market Price - Futures Market Price = Basis
It is important because it can be used to create price expectations based on the futures market, which can in turn inform marketing and risk management decisions. This approach assumes that futures markets are unbiased predictors of cash prices. Rearranging the formula above, cash market price can be calculated as futures market price plus basis. For example, if the August feeder cattle futures contract is trading at $170/cwt and historical basis at the local market for steers M&L 1 is -$10/cwt, then a producer can reasonably expect to receive $160/cwt for their animals of that type when they market their animals in August.
Basis calculations in both the database and represented in the figures below were developed using a method that is intended to mirror the most relevant information for a real-world producer. The average monthly futures price data was calculated by averaging the daily closing price for the nearest unexpired CME feeder cattle (FC) futures contract for each month. For example, the January futures price is the average of all trading day closing prices for the January FC futures contract until the open interest for that contract went to zero and for all the trading day closing prices for the March contract until the end of January. This gives the average monthly futures price for January, which is subtracted from the average monthly cash market price of each location, which gives the average monthly basis. This is done for medium and large 1 & 2, steers and heifers from 2016-2021. The reason for this method of calculation is because the FC futures contract only trades certain months of the year, specifically those in which many feeder cattle are marketed. These months are January, March, April, May, August, September, October, and November. Thus, for months which do not have a contract the nearby, or closest, open contract is used.
In addition to aiding in marketing decisions, basis data provides price risk management insight by showing the basis risk that the local market carries. This is important, as noted in the Livestock Risk Protection section examples, because it means that although a producer may have price coverage on their cattle or have hedged their cattle, they may still suffer losses due to the difference between the cash and futures market prices. This is known as basis risk (CME Group). Understanding historical basis trends can help a producer mitigate basis risk, by marketing cattle at a time of year, location, or of a size that minimizes the historical basis. A smaller basis for a particular location, season, or cattle type means the more accurately a producer can set a target price for their animals and make better informed input and management decisions.
Basis describes the strength of a local market relative to the futures price (The Board of Trade). Once basis is calculated and averaged for different locations, these locations can be compared to each other. Variation in basis across locations is due to a variety of factors. It can be due to the type and volume of cattle that are sold at that market, the type of buyers present at that market, and the geographic location of that market. Basis can help in comparing cash prices in the local market. For example, if market A has an average basis in May of -$10/cwt for 700-799 lbs steers and market B has a basis of -$2/cwt for 700-799 lbs steers, then we know that market B’s cash prices are on average $8/cwt higher than market A. Stronger basis means higher local cash prices.
The four following figures show the average basis across locations for the 700-799 lbs weight group for each cattle type. The trendlines in each figure are a visual representation of the comparative basis performance and cash price performance of each market throughout the entire year. In these figures the futures price is constant across each location, so that means that the basis of each market shows the strength or weakness of the price at that market for the specified cattle type in any given month.
Figure 1 Average Basis 2016-2021 for Steers M&L 1, 700-799 lbs
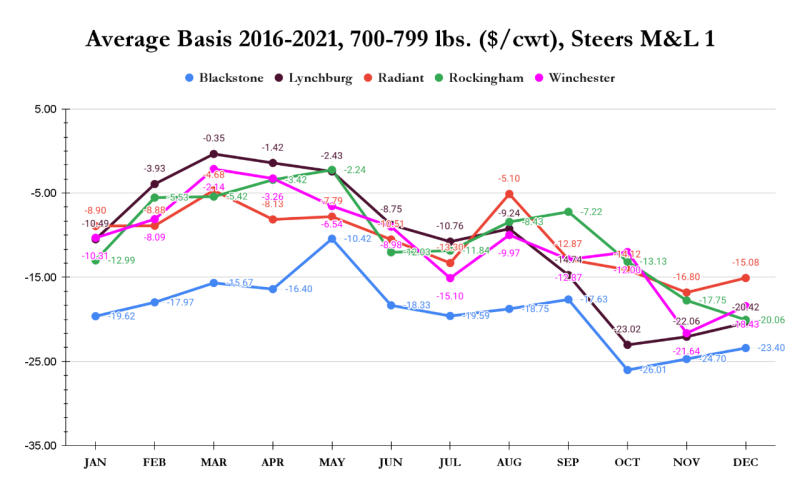
Figure 1 shows the average monthly basis for M&L 1 steers across the five locations. This provides a comparative analysis of the different locations’ basis and cash prices. The Blackstone livestock market, represented by the blue line, can be seen to have the weakest (most negative) basis of the five markets. For example, in May, a producer could have a price expectation of $10/cwt under the futures price for their 700-799 lbs M&L 1 steers if they marketed them at Blackstone, while having a price expectation of $2/cwt under the futures if they marketed at Rockingham. This $8/cwt difference should be considered along with transportation cost to determine the best location to sell cattle. Note that basis patterns change throughout the year. All of the markets have variations month to month, but some go through greater seasonal swings, as shown by Lynchburg having the strongest (least negative) basis in the first part of the year, and the weakest basis (Blackstone excluded), in the latter half. It is important for producers to consider how different markets perform at different times of the year as they set their target animal weights and manage their breeding program for frame size and muscling. Selling the specified cattle type at times of the year when the basis is strongest can help to reduce price variability and increase profits.
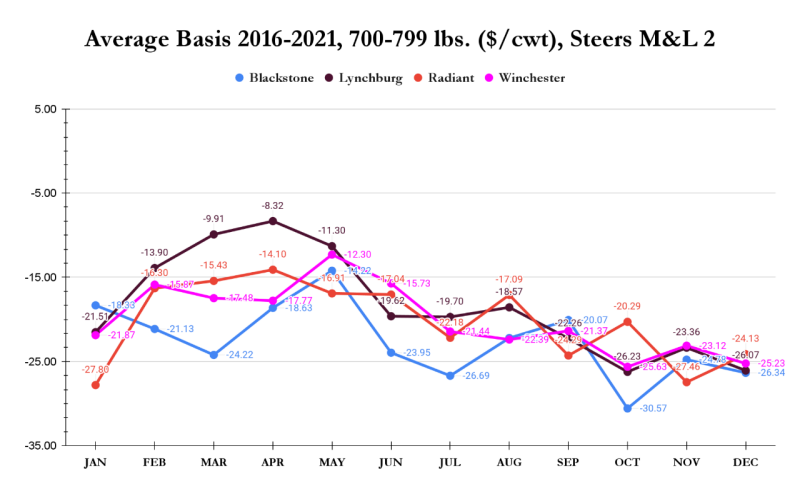
Figure 2 Average Basis 2016-2021 for Steers M&L 2, 700-799 lbs

Note: Rockingham is excluded from this figure due to insufficient data.
Figure 2 shows the same calculations as Figure 1, except for steers M&L 2. Lynchburg shows the strongest basis from February through May, but different markets are stronger throughout the rest of the year. One of the biggest differences in Figure 1 from Figure 2 is how much more closely Blackstone performs to the other markets, even having the strongest basis in January and September. While there are still significant differences from market to market for this animal type, for instance a $14/cwt difference between Blackstone and Lynchburg basis in March, there is not as much clarity as to the advantage of one market over the other in this instance.
Figure 3 Average Basis 2016-2021 for Heifers M&L 1, 700-799 lbs

In Figure 3 for heifers M&L 1 we see a return to patterns more similar to Steers M&L 1 with Blackstone having weaker basis throughout the year. Other locations have traded places however, such as Lynchburg having some of the weakest basis most of the year and Rockingham appearing to have the strongest. It is important to note that data for Rockingham’s basis (represented in green) should be interpreted with care as there were missing values for some months of the years in the 2016-2021 period, and therefore the average calculation sometimes included fewer years. Due to the cyclical nature of cattle markets, for example, exceptionally strong prices in 2014-15 and exceptionally low prices in 2016-17, the exclusion of one or two years from an average calculation due to there not being any data available, may significantly affect the results. Rockingham was still included however as there were observations for approximately 85% of the data points included in this figure.
Figure 4 Average Basis 2016-2021 for Heifers M&L 2, 700-799 lbs
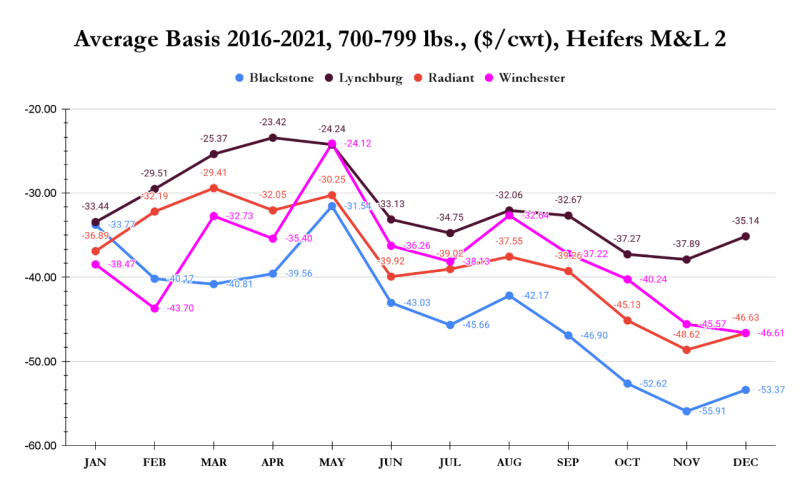
Note: Rockingham is excluded from this figure due to insufficient data.
Figure 4 shows trends for heifers M&L 2. The trends here are very clear and should provide the average Virginia cow/calf producer a good picture of the relative strength and weakness of the four markets shown in this graph. Lynchburg very consistently has the strongest basis throughout the year and Blackstone, with the exception of January and February is consistently the weakest, although it is very close in May to the other three markets. Lynchburg has strong basis from February through May and continues to strengthen from January to April before falling off slightly in May. Meanwhile, Radiant strengthens from January to March and falls off in April before recovering slightly in May. Winchester sees a $9/cwt strengthening in basis from February to March, followed by a weakening in April, and then another $9/cwt strengthening in May. Blackstone exhibits an inverted curve from January to May, which is exactly opposite to Lynchburg. The significant weakening in basis in Blackstone for this animal type through the late winter and early spring means that there could be significant price reduction for a producer marketing this cattle type in those three months at this location.
The types of patterns shown in all four figures are designed to aid in price risk management decisions of producers. There are multiple factors to consider in this; first, the basis for 700-799 lbs cattle in Virginia is almost always negative. One key factor that contributes to this is that a great majority of these cattle will be hauled to the Midwest to be finished on feedlots. The difference between the local cash price and the futures price is due to the expense and shrink associated with this travel to the Midwest. While the locations represented here are only a small sample of feeder cattle markets in the state, this model is possible to replicate at any market throughout the state. Weekly, monthly, and seasonal auction data is publicly available at the Virginia Department of Agriculture and Consumer Services Market New website: https://www.vdacs.virginia.gov/markets-and-finance-market-news-livestock.shtml. By tracking the relevant cash market data and the futures prices from the CME’s feeder cattle webpage (https://www.cmegroup.com/markets/agriculture/livestock/feeder-cattle.html), individual producers can observe historical basis trends which will help predict individual location’s prices.
Basis in Virginia has substantial seasonal variation, as a result of a variety of market factors, and changes substantially from year to year. Identifying seasonal trends across locations can help set target marketing dates that will capitalize on the strongest basis and cash prices. For example, if a producer is developing a calving schedule with their herd and aiming to market cattle in May, when basis is historically the strongest, they could take advantage of relatively higher prices. The following four figures have been developed to show seasonal patterns in basis and local cash prices. These figures were developed by taking the average monthly basis for each of four or five locations and averaging them together for each animal type. The six-year trendlines in each graph help to demonstrate what months of the year are likely to have the strongest (least negative) basis for the animal type. The observed basis levels for the last three years demonstrate variation around the means and reflect the amount of basis risk, or inability to predict basis precisely.
Figure 1 Five Location Average Basis, 700-799 lbs.($/cwt) Steers M&L 1

Figure 2.2.1 Five Location Average Basis, 700-799 lbs.($/cwt) Steers M&L 1
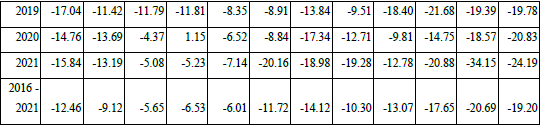
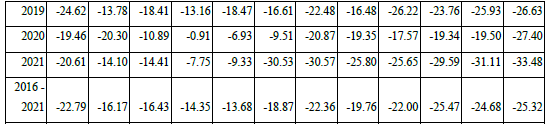
Figure 1 shows the average basis calculated across the five locations considered in this study. The table below the figure shows the data specific to each month for the three years and average of six years considered. The 2016-2021 average trendline demonstrates how basis varies across seasons. The bars for 2019, 2020, and 2021 reveal that average historical basis, which is often the best indicator of future basis, can be different from observed basis in some years. For example, while the average basis expectation for April was $-6.53/cwt, it was much weaker in 2019 at $-11.81/cwt, and much stronger in 2020 at $1.15/cwt. On the other hand, the 2021 April basis was fairly consistent with expectations. Note, however, that even in the years when observed basis levels were not consistent with expectations, the overall seasonal patterns were, meaning that November basis was always weaker than April basis. For this figure, the strongest basis was in March while the weakest was in November. This means that for steers M&L 1, March, April and May could be the best months to market animals as they will have, on average, the strongest cash price relative to futures. Another point is that, in August we see a strengthened basis compared to June and July. This is a time when many Virginia cattle producers take feeder cattle off of summer pasture and start selling them. While the basis does strengthen in August over the previous two months, it is still $4/cwt weaker than the May basis. This should be considered when determining whether or not to hold cattle over the summer.
Figure 2 Four Location Average Basis, 700-799 lbs. ($/cwt) Steers M&L 2
Note: Rockingham is excluded from this figure due to insufficient data.
Steers M&L 2 exhibit similar patterns as the number 1’s, but more distinctly strengthen in April and May. That stated, it is important to note that the scale is different. That is to say, number 2 steers have lower basis on average throughout the year than number 1’s. The clear inflection point in May and August also indicate a potential gain from marketing animals at this time of the year over others. Producers should consider the marginal difference between each month. For example, the difference between January and February is a substantial $6/cwt strengthening in basis. While the difference between May and June is a $5.50/cwt weakening, indicating lower prices in the local cash markets.
Figure 3 Five Location Average Basis, 700-799 lbs. ($/cwt) Heifers M&L 1

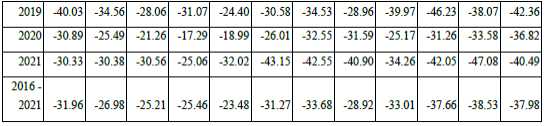
Substantially weaker basis is observed in the basis for these number 1 heifers than either of the steer types. This is largely due to the difference in the type of animal being marketed. The CME FC futures contract is a promise to deliver 50,000 lbs of steers weighing 650-849 lbs each, graded medium-large frame with #1-#2 muscling at the expiration of the contract (Lacy et al. 2014). As the cattle being considered in the basis calculation differ from this animal the historical average prices exhibit less correlation. Interestingly though, the pattern of stronger basis being observed in March through May and August still remains. While heifers will not perform as well as their steer counterparts, the similarity in patterns means that producers who produce uniform calves, which will be roughly 50% steers and 50% heifers, can follow a similar marketing schedule.

Note: Rockingham is excluded from this figure due to insufficient data.
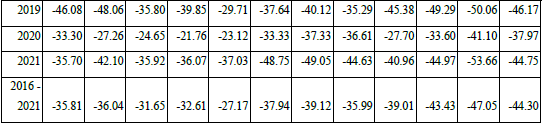
While number 2 heifers demonstrate the weakest basis of all four cattle types, it is particularly important to note that their difference in May basis is very pronounced, unlike the other four cattle types. This means that there is a distinct marginal advantage to marketing this cattle type along seasonal trends that may be less pronounced in other cattle types. For instance, across the other three cattle types the marginal difference between the strongest and second strongest month is no more than $2/cwt, whereas with these animals the difference between April and May basis is almost $4.60/cwt.
The last two sections have shown how basis varies across location and time for all four cattle types in the 700-799 lbs weight category. While many cattle in Virginia are sold within this weight range, many cattle are also sold at lighter weights, often at or soon after weaning. The following figures are designed to translate the location and seasonal trends observed previously to the four lighter weight categories considered in the dataset. These figures represent the average premiums (or discounts) for different weight groups of animals as compared to the 700-799 lbs weight group. The values on the figure are the difference in basis from the 700-799 lbs category. The 700-799 lbs cattle average basis has been collapsed to zero and is represented by the x-axis on these four figures. This means that each trendline shows the relative basis of the respective weight category as compared to the 700-799 lbs category. Each trendline was calculated by finding the average of the difference in basis from the 700 lbs category across the three locations of Lynchburg, Radiant, and Winchester. Blackstone and Rockingham were excluded from these calculations due to there not being enough data available across all weight categories in the time period.
Figure 1 Basis Comparisons, 2016-2021, dif. from 700 lbs., ($/cwt) Steers M&L 1

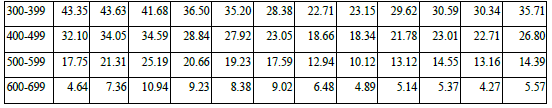
Figure 1 shows a consistent positive pattern in basis differences across weight groups. This means that on average there is a premium for selling an animal lighter than 700-799 lbs. The size of this premium can help a producer calculate the value of gain. This premium represents the difference in value of the steer as it varies from the FC futures contract specifications as discussed before. In order to use this premium information, producers can calculate total revenue for each animal they could market. For example, in March the average premium for 600-699 lbs steers M&L 1 is approximately $11/cwt over 700-799 lbs steers M&L 1 (see table above). This means that if the expected price of a 700-799 lbs steer is $160/cwt in March (Futures + Basis = Cash Price), then the expected price of a 600-699 lbs steer would be $171/cwt. The total revenue for a 6.5 cwt steer in March would then be $1,111.50 (6.5 cwt x $171/cwt). In order to calculate the value of gain of letting that steer get heavier, then there would have to be a time difference in order to let that steer get to a heavier weight. So, if it took 60 days for that steer to get to a weight of 7.7 cwt (2 lbs average daily gain), then the total revenue would be calculated based on the May cash price for the heavier weight animal. If the expected price stayed the same at $160/cwt for the 700-799 lbs steer, then the total revenue would be $1,232 (7.7cwt x $160/cwt). This is a net gain of $120.50 in total revenue. In order for a producer to choose which weight to market at they would have to account for the cost of that gain. Namely the feed and management costs associated with keeping that steer the additional 60 days. An individual producer would need to calculate his own cost of gain in order to determine the profitability of retaining a steer in this situation. If the cost of gain is less than the increase in total revenue, then it would be advantageous for the producer to retain the cattle until they are heavier.
Another important trend to note in this figure is that each weight category’s trendline gets closer together in June-August. This means that the relative premium for each weight category is reduced. Also, as these lines draw closer to zero the relative advantage of marketing a lighter weight animal is reduced. In the month of March, the premium of 500-599 lbs steers over 600-699 lbs steers is $14.25/cwt ($25.19/cwt - $10.94/cwt). In August this was reduced to $5.23 ($10.12/cwt - $4.89/cwt). Depending on when a producer plans to market animals and the relative premiums available for different weights of animals, there could be advantages in increased cash prices and reduced basis risk throughout the year. If a producer decides to hold an animal until it is heavier, they need to ensure that they have a risk management plan in place to cover themselves in the event that prices fall.
Figure 2 Basis Comparisons, 2016-2021, dif. from 700 lbs., ($/cwt) Steers M&L 2

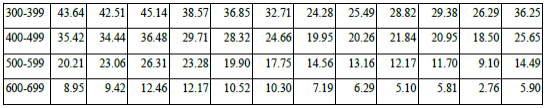
Figure 2 shows the basis comparison trends for steers M&L 2. Similar to Figure 1, there are significant premiums in the March-May timeline, this collapses however in the summer months of July and August. In November there is only a $2.76/cwt premium for 600-699 lbs steers. Depending on a producer's individual cost of gain and marketing schedule, these trends could have significant implications. For instance, if a producer was deciding whether to market 650 lbs steers in October or 750 lbs steers in November the premium for the lighter animal may not have a positive effect. Lighter animals, while carrying a premium, can reduce total revenue because there are simply fewer pounds of animal being sold. A 650 lbs steer sold in October at $150/cwt results in a revenue of $975, while a 750 lbs steer sold in November at $147/cwt results in a revenue of $1,102.50. Depending on a producer's cost of gain to raise that steer from 650 lbs to 750 lbs, the additional $127.50 in revenue may be worth the discount in price to hold that steer until it is heavier. Calculating cost of gain will vary with each individual producer’s operation. In the spring months of the year when grass is abundant, it is not difficult for a producer to feed an animal until it is heavier due to the availability of high-quality forage. The main cost would be management and any additional supplies required to raise the animals. Where it can become difficult for a producer to economically raise cattle to a higher weight is in the winter months when forage is scarce and management can quickly become more expensive and burdensome, thus reducing the opportunity for heavier animals to be sold.
Figure 3 Basis Comparisons, 2016-2021, dif. from 700 lbs., ($/cwt) Heifers M&L 1
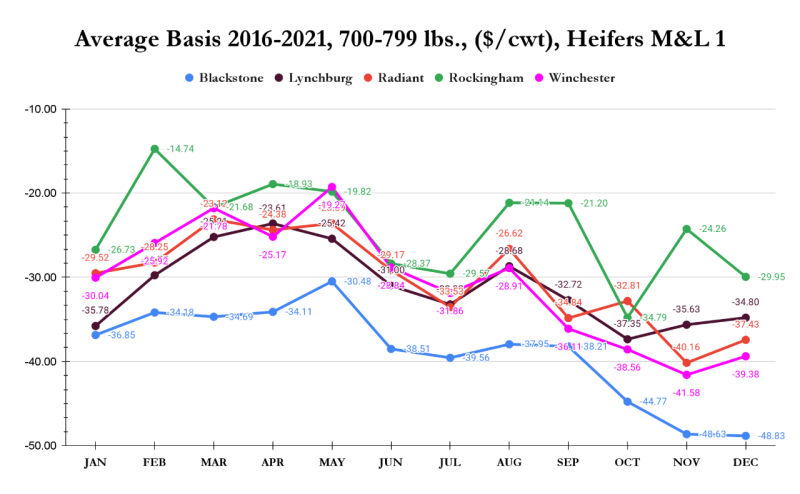
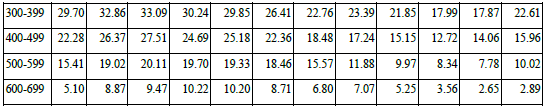
Figure 3 shows a notable trend for the heifers M&L 1 basis premiums in the 500-599 lbs weight category. While the 500-599 lbs category does show a strong premium over the 600-699 lbs category in the steers, this heifer type has a strong positive premium of $9-$10/cwt from January to July. This consistent advantage through the better part of a year could mean that there is an opportunity for producers to capitalize on this premium by selling lighter weight heifers. This heifer type also demonstrates a fairly consistent pattern across all four weight categories, with reduced month to month volatility as observed in the steers. This means that the different weight categories are strong predictors of premiums in basis. As an animal moves away from the FC futures contract specifications, producers have an opportunity to capitalize on the premiums available for these animals.
Figure 4 Basis Comparisons, 2016-2021, dif. from 700 lbs., ($/cwt) Heifers M&L 2

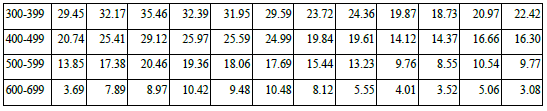
Figure 4 demonstrates fairly similar patterns for heifers M&L 2 as Figure 3 does. Among the 300-399, 400-499, and 500-599 weight categories, a very consistent strengthening trend is observed from January to March, and this shows producers an opportunity to capitalize on timely marketing regardless of the weight of the heifers they are marketing. As basis weakens into the summer and fall months, it is important to determine the cost of gain when choosing to market heavier animals. As discussed previously however, there may not be a true advantage to marketing a lighter animal at different times of the year as the premium available is offset by the reduction in revenue from fewer pounds on the hoof.
Variations in basis across location, time and season, and cattle weight can have many confounding effects on a producer's ability to predict prices. While feeder cattle prices and basis are the result of many national and even international market effects, understanding how historical basis and cash prices are affected by factors such as location, time, and weight enables producers to predict more accurately what their expected price should be. The purpose of this study is to help reduce volatility in incomes and cash flows of average cow/calf producers in Virginia through price risk management. While some producers may not be able to significantly change their production model to market at different locations, seasons of the year, or weights of cattle, simply being able to predict more accurately what the cash price and/or basis will be for their cattle provides them with the opportunity to optimize their operation. If a producer can look at the feeder cattle futures market price for the month which they are planning on marketing their cattle in and then develop a target price based on the historical basis of their cattle type at their local market, they will be able to make much more informed decisions about the investment in inputs that they put into their operation and costs associated with raising their cattle.
Lacy, Curt R., Griffith, Andrew P., McKissick, John. “Using Futures Markets to Manage Price Risk in Feeder Cattle Operations.” June 2014. University of Georgia. Accessed May 27, 2022.
“Self-Study Guide to Hedging with Livestock Futures and Options” CME Group. cmegroup.com/agriculture. Accessed June 15, 2022.
“Understanding Basis” 2004. The Board of Trade of the City of Chicago. EM12-4R2