Basis patterns across time and seasonality
Changes in grain basis are common as we move through different seasons and times of the year. Virginia is no stranger to these seasonal changes. It is important to understand seasonality with grain basis for marketing purposes. Producers and merchants work throughout the year to market their grain at prices that meet their price expectations and cover their break-even costs. Without a firm understanding of the market and market patterns, this task becomes even more challenging and could be the difference between a firm staying profitable or not. The aim of studying seasonality and variations across time is to determine the times within local markets or throughout the state when a producer or merchant can capitalize on the strongest basis based on historical trends. The figures in this section show the average monthly basis for the last three years across the selected six locations for corn and soybeans and three locations for wheat. To provide a historical context, the recent basis is plotted against a line that represents the recent five-year average for each commodity.
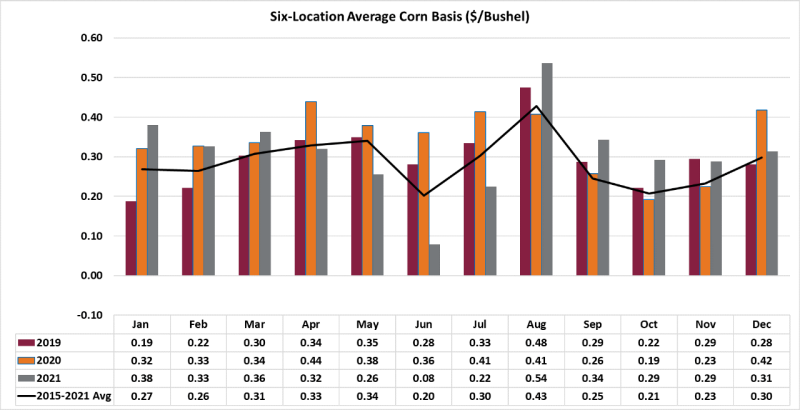
Figure 1 shows that on average, there were no negative basis months observed for corn from 2019-2021. This strong positive basis reflects dependable demand throughout the state over time. The trend line (black line) for the averages across years shows wide variability in corn basis over the past three years. Corn basis in Virginia tends to be the strongest in August when the supplies become tight right before the new harvest. Corn basis is weakest in June and October, which is associated with corn harvest in October and wheat harvest bringing some feed onto the market in June. Winter wheat can be substituted for corn in Virginia feeding operations. These patterns would suggest to producers that August, May, and April tend to have the most attractive basis and therefore would be the best months to market their corn.
Figure 1 also shows the variability in basis over the last three years. For example, the corn basis in June 2019 was $0.28/bushel. That same June corn basis in 2020 and 2021 was $0.36/bushel and $0.08/bushel, respectively. This variability is a big challenge for producers, as the historical average basis is used by many to establish price expectations for their grain for future delivery, and may not be a very accurate measure due to large year-to-year swings.
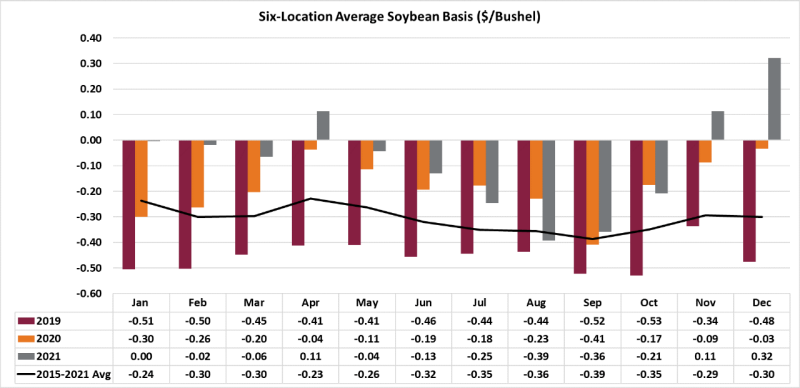
Figure 2 shows that on average in Virginia, the soybean basis is mostly negative from 2019-2021, with a few exceptions in 2021. This is the opposite of the observed trend in the corn data. Across months, January, April, and May show the strongest basis values with April being the strongest, while August and September are the weakest. This would suggest that April, May, and January are the most attractive months for Virginia producers to market their soybeans. This pattern is different from corn’s pattern due to the difference in commodities. As stated earlier, there is much more domestic demand in the state for corn rather than soybeans. Most of the soybean production in Virginia is shipped overseas for livestock feed. This subjects Virginia soybeans to the seasonality of U.S. soybean exports. Under normal conditions, the U.S. soybean export pace tends to increase in the winter months (i.e. November and December) (USDA, 2017). This is the time when the U.S. has the most soybeans in storage and before other foreign competitors, such as Brazil and Argentina harvest their soybean crop. Therefore, an elevated basis at these times is justified to encourage delivery for world export. This also brings reason to another trend found in figure 6. The year 2019 (maroon) shows the weakest basis values for each month throughout this graph and in turn impacts the average basis across the three years. That particular year was a very recognizable year for soybeans as it was the year following the 2018 Trade War between the United States and China. The Trade War affected many commodities, but soybeans were at the forefront. The impact was especially felt in Virginia as observed in figure 2 due to the export limitations of the Norfolk Terminal. After the signing of the Phase One Agreement in January of 2020, basis values rallied in recovery from the previous lows.
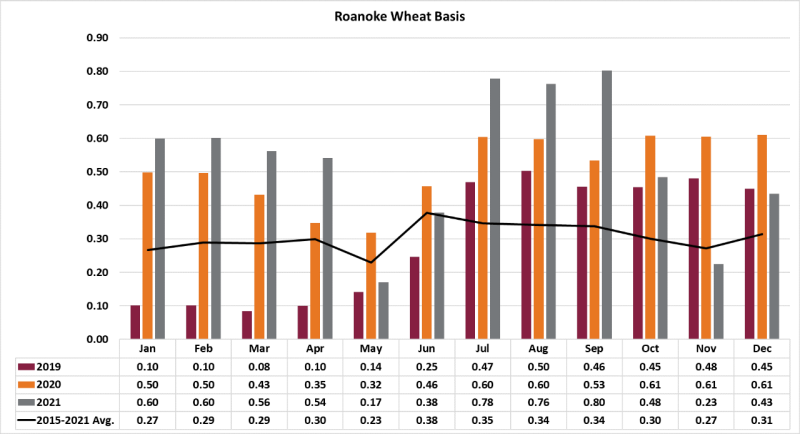
Figure 3 shows that on average all the basis bids for the Roanoke wheat market were positive in the past three years. November, January, and May show the weakest basis while June, July, August, and September show the strongest basis months. This is a bit counter-seasonal, as soft red winter wheat is harvested in late June into July in Virginia. Normally the weakest basis would occur during those harvest times. This is not the case with Roanoke basis. In fact, it is the time of the strongest basis. The reason for this phenomenon is the transportation logistics from the production of wheat in Virginia (Middle Peninsula, Eastern Shore, and Wakefield) to Roanoke where a flour mill is the consumption factor. This is the time of the year when wheat stocks are thin and the wheat mill is forced to increase its basis to encourage delivery to keep its operation running.
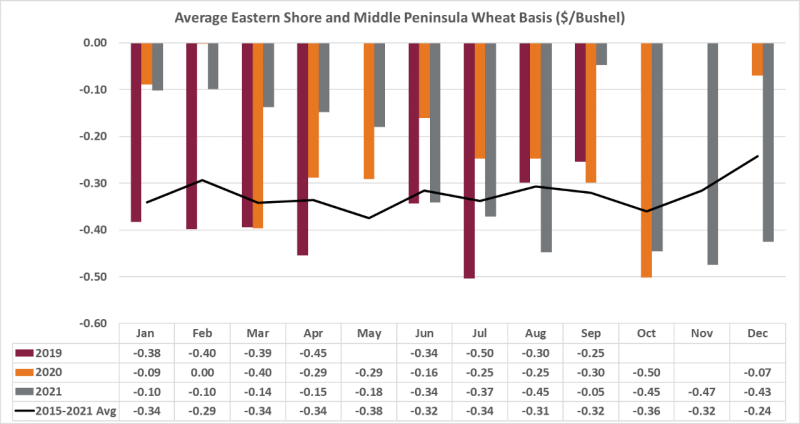
Figure 4 shows that on average the basis bids for the Eastern Shore and Middle Peninsula wheat markets were negative in the past three years. A general trend of weak wheat basis for these two locations can also be observed. Another key attribute of this figure is the missing basis data points in May, October, November, and December. Some of these locations only buy wheat in certain months of the year. This makes it difficult to find trends and patterns over time in the Virginia markets, unlike what has been done for corn and soybeans. Other wheat marketing locations such as the Wakefield and the Norfolk Terminal could have been considered, but they have been omitted due to the lack of bids throughout the years. These locations tend to only buy wheat during the harvest time when supply is plentiful or under certain circumstances when they can utilize the grain or arbitrage it to other locations.
References