Basis patterns and spatial variability
When looking at the factors that comprise basis values, the largest piece is transportation costs, followed by handling and storage costs. Basis values are also heavily influenced by local commodity supply and demand fundamentals (Adjemian 2011). Virginia differs from the “status quo” midwestern states, in the fact that the demand and production for grains are separated by hundreds of miles. With the spatial differences seen in Virginia, and transportation costs being the larger component of basis, it would be expected that basis values for many of Virginia’s regional markets would differ extremely from others.
Virginia is unique because the production and supply centers for the three commodities are in various locations across the state. With these fundamentals in mind, there are extreme price differences across the state as well. Those differences are described as the basis. The eastern half of Virginia is unique in that it is the main grain-producing region of the state. A combination of favorable climate, flat lands, and fertile soils all make this part of the state a productive agricultural region. The eastern part of the state also has its fair share of demand centers for grain as well. Perdue Farms, Tyson Foods, Mountaire Farms, and other companies have poultry production houses throughout the Eastern Shore of Virginia along with Smithfield Foods’ strong presence in the market to feed their hogs in southeastern Virginia and northern North Carolina. These companies aggressively originate grain during harvest keeping demand for corn strong for feed grains. Perdue Agribusiness also operates a soybean crush plant in Chesapeake which keeps demand for the oilseed high. These companies have this ability in the east due to increased storage capacities at many different elevators, utilizing bins, bags, barges, and bunkers. In addition to the poultry and swine feed demand, most of the eastern part of the state is also located within an hour or two drive from the Port of Virginia. The Port of Virginia is an international shipping hub located in Norfolk, Virginia that connects the Commonwealth of Virginia with the rest of the world via container and bulk shipping. This keeps grain and oilseed demand high and allows the state’s grain production, no matter the commodity, to be shipped to our global partners that need them for various uses.
Turning the focus to the western part of the state, this is the main demand center for most of Virginia’s grain. As of December 1, 2021 cattle and calves accounted for ~$372 million in agricultural cash receipts and broilers and turkeys accounted for ~$625 million and ~$316 million in agricultural cash receipts respectively[1] (VDACS 2021). The greater part of this livestock production is centered in the Shenandoah Valley which is centered around the Harrisonburg area. Companies such as Cargill, Georges Family Farms, Virginia Poultry Growers, etc., have feed mills and elevators in the Valley area in order to supply feed to the livestock in the area. Roanoke, a region in the west, is home to a large flour mill that keeps demand high for quality milling wheat. An issue arises with these mills in the west due to their storage capacities and the minimal feed grain production in the western part of the state. The climate, mountainous terrain, and marginal soils create a situation where producers in this area don’t produce enough feed grains to supply the mills year-round. This elevates basis levels in these areas and places importance on grain out of the eastern half of the state and other states. It is also worth noting that many of these regional locations are buying hubs for one particular grain (i.e. Harrisonburg has a high demand for corn and Roanoke has a high demand for wheat). However, in many cases, they will still buy other grains as well with hopes of capitalizing on arbitrage opportunities throughout the state.
The three following figures show the average basis from 2015-2021, across six locations for corn and soybeans and three locations for wheat in Virginia. Some of the locations were omitted due to a lack of cash price data released from VDACS. This lack of cash market bids has many causes but is mainly due to “off-cycle” times in the grain production cycle coupled with regional supply and demand. It is important to note that the futures prices used are constant across all locations for each commodity. What is changed in the following three figures is the cash price and subsequently the basis for each location. This allows the viewer to visualize the strength or weaknesses of the regional locations to the futures market and to compare basis values across the locations as well.
[1] While this data represents the entire state, much of this livestock production is located in the western half of the state.
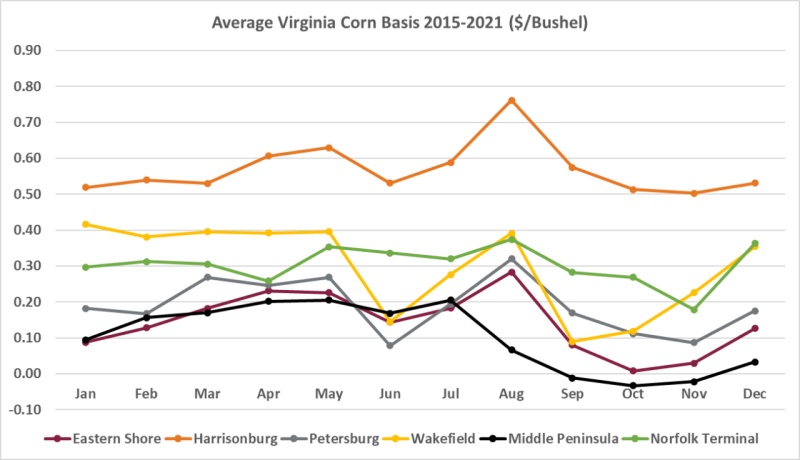
Figure 1 is indicative of just how strong corn basis in Virginia is. With the exception of average harvest basis in the Middle Peninsula, all of the locations’ average corn basis is positive. Denoted by the orange line, on average, Harrisonburg has the strongest corn basis in Virginia throughout the year. This is supported by the earlier inference that poultry feed demand and other livestock demand should keep basis strong in that area. The black, maroon, and grey line represent the Middle Peninsula, Eastern Shore, and Petersburg markets respectively. These locations tend to follow the same trend and consistently have a weaker corn basis compared to the other markets. These areas are located in heavy production areas and this contrast in basis can be explained by transportation costs and other associated costs of transporting the grain to the consumption areas. Another interesting pattern observed in Figure 1 is the large basis increase from June to August and then a subsequent decrease from August to September. This is likely due to old-crop corn stocks running low before the new crop harvest begins. When this happens demand regions are forced to offer premiums (stronger basis) to encourage the delivery of corn from other regions. This presents an opportunity for producers that have on-farm storage. If producers are able to store their corn for later delivery such as May or August of the following year, they could capitalize on basis premiums offered by the market.
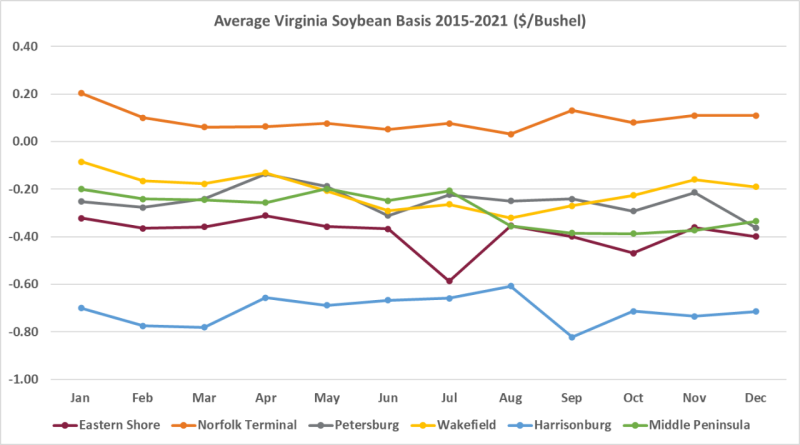
Figure 2 represents the average Virginia soybean basis from 2015-2021 over six locations similar to what was produced for corn. However, we see many different results. The orange line represents the Norfolk Terminal basis region and shows the strongest average basis for soybeans over this six-year period. Likewise, the blue line represents the Harrisonburg area basis bids for soybeans and shows the weakest soybean basis across all locations. This is especially interesting considering the Harrisonburg area reported the strongest basis for corn, yet the weakest for soybeans. This disconnect is because most Virginia-grown soybeans are sold and shipped overseas (i.e. via the Norfolk Terminal). Perdue Agribusiness also has the soybean crushing facility in Chesapeake Virginia that processes Virginia soybeans as discussed earlier. This places the demand center for most of Virginia’s soybeans in the Norfolk Terminal region. The Harrisonburg market is the furthest soybean bidding market from the Norfolk Terminal, explaining this basis difference. Another important difference that is observed in figure 1 compared to figure 2 is that the main production areas such as the Middle Peninsula, Petersburg, and the Eastern Shore have average basis bids that are closer to the Norfolk Terminal. Again, figure one shows that those production areas aren’t geographically a long distance from the demand center keeping basis stronger. Lastly, figure 2 shows that the Virginia soybean basis has a rather stagnant pattern and doesn’t change as much month over month as what was observed for the Virginia corn basis in figure 1. There are slight premiums offered in the soybean market in January but overall, the soybean basis doesn’t see the volatility that the corn basis in Virginia sees. This makes it harder to seek out those premiums that are offered in the other markets that are discussed.
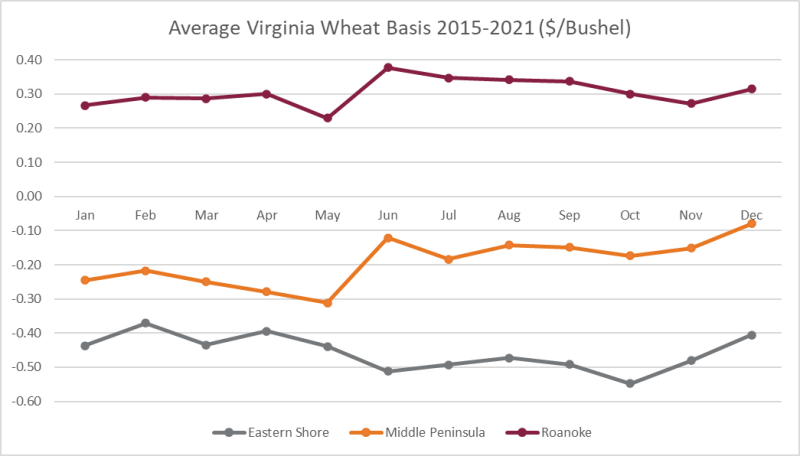
Figure 3 represents the average Virginia wheat basis from 2015-2021 over three locations. The Roanoke area is represented by the maroon line while the Middle Peninsula and Eastern Shore are represented by the orange and grey lines respectively. As expected, the Roanoke area had the strongest wheat basis when compared to the other two locations. As discussed earlier, a large wheat mill in Roanoke keeps demand for good quality wheat high in that area which in turn keeps basis strong. The Eastern Shore region consistently has the weakest basis of the three markets. This is due to the low demand for high-quality wheat on the Eastern Shore and is likely representative of high transportation costs to a flour mill. While the demand is low for high-quality wheat on Virginia’s Eastern Shore, lower-quality feed wheat is bought by many poultry companies and livestock feeders as it can be milled and utilized in animal rations similarly to corn. However, most of the time when this is the case, the “feed wheat” will be priced differently and is not considered US No. 2 Soft Red Winter Wheat. Perhaps the most interesting market to consider is the Middle Peninsula wheat market. The basis in the Middle Peninsula is fairly weak when comparing it to Roanoke’s, however, these two markets follow a very similar trend when observed closely. Figure 3 shows that the Middle Peninsula and the Roanoke basis values tend to move with each other and with the same magnitude as well. Throughout the year, the basis values at these locations seem to be separated by approximately forty to fifty cents. The likely cause of this pattern is the strong presence of Mennel Milling in each location. Mennel aggressively originates wheat in the Middle Peninsula market and transports it by rail and truck to supply their Roanoke flour mill. Therefore, this forty to fifty cents gap between the markets can be assumed as the transportation and handling costs between the two locations.
It is important to understand these spatial differences with Virginia basis for marketing purposes. With Virginia’s volatile grain basis, along with the volatility of futures markets as well, finding the right price for a producer to sell their grain can be difficult. The patterns that have been discussed above may offer a different outlook on grain marketing. Many producers sell grain directly from the field at harvest time, while some harvest and store the grain in hopes of receiving better prices in later months at their local market. However, if the producer had enough labor and the right hauling equipment, couldn’t he/she capitalize on arbitrage opportunities by hauling the grain to a different market across the state if it proved worth it? The answer to this question depends on many things rather than the few that are discussed, however, if this profit opportunity exists then it would be a “no-brainer” for the producer to capitalize on this opportunity. This strategy places an even bigger emphasis on calculating a firm’s break-even costs and having a good knowledge of not just the firm’s local basis, but rather the basis around the state and basis bids from delivery locations that that firm has the ability to deliver to. There are also experienced professionals that specialize in these arbitrage opportunities and can help producers such as the Virginia Farm Bureau’s Grain Division and private companies that offer similar services.
References
Adjemian, M. K., T. Kuethe, V. Breneman, R. Williams, M. Manfredo, and D. Sanders. 2011. “A Spatial Approach to Estimating Factors that Influence the Corn Basis.” Proceedings of the NCCC-134 Conference on Applied Commodity Price Analysis, Forecasting, and Market Risk Management. St. Louis, MO.